Introduction #
Kuzzle gives the possibility to debug a Kuzzle instance using the Debug Controller actions.
The Debug Controller gives you the ability to execute methods and listen to events produced by the Chrome Devtools Protocol.
It's easier and safer to use the Debug Controller to debug Kuzzle remotely than exposing the debugger port using node --inspect since the Debug Controller is limited by the authentication mechanism of Kuzzle making it impossible to use if you don't have the proper rights to use it. Whereas when launching Kuzzle with node --inspect you need to setup some Port Forwarding from your host machine to your local machine to be able to debug Kuzzle remotely, and you need to be sure that no one can access your instance using the Debug Port exposed.
By default access to the Chrome Devtools Protocol through the Debug Controller is disabled, to use the methods of the Chrome Devtools Protocol you need to enable it in the kuzzlerc file by setting security.debug.native_debug_protocol to true and rebooting your instance.
Debug Kuzzle remotely using the Debug Controller and the Chrome Inspector #
Prerequisites #
To be able to debug Kuzzle remotely using the Chrome Inspector tool you need:
- A user allowed to access to all Debug Controller's actions. See the Permissions page on how to setup the proper permissions.
- To set the config
security.debug.native_debug_protocoltotrue, to allow the Debug Controller to execute actions from the Chrome Devtools Protocol, then restart your application. - Kourou, the Kuzzle CLI, installed. You can install it using
npm install -g kourou. - The Chrome Browser installed.
How to Debug #
Step 1 - Setup proxy server #
To debug Kuzzle remotely using the Chrome Inspector, you need to open a proxy server that will connected to Kuzzle to translate commands sent by the Chrome Inspector with the Chrome Devtools Protocol's format into actions of the Debug Controller. Don't worry this is very easy to do, you just have to use Kourou to perform this:
kourou app:debug-proxy --host <Kuzzle Host> --port <Kuzzle Port> --username <username> --password <user password>This will open a proxy server that will connects to your Kuzzle instance using the given username and password and will do the translation automatically.
Remember that the user must be allowed to use all the actions of Debug Controller and you need to set the config option security.debug.native_debug_protocol to true, to allow the Debug Controller to execute actions from the Chrome Devtools Protocol.
Once the proxy server has started and is successfully connected to your Kuzzle instance, you will will see a message like this in your terminal:
[ℹ] Connecting to ws://<host>:<port> ...
[ℹ] Connected to Kuzzle node: knode-lackadaisical-archimedes-79903
[✔] Listening on port 9222, forwarding to Kuzzle at <host>:<port>
[ℹ] Showing to Chrome Debugger as "Kuzzle Debugger - <host>:<port>"
[ℹ] Waiting for Chrome Debugger to connect...[✔] Listening on port 9222, forwarding to Kuzzle at <host>:<port>You can see here that the proxy server is listening on port 9222. This will be needed for the next step.
Step 2 - Configure Chrome Inspector #
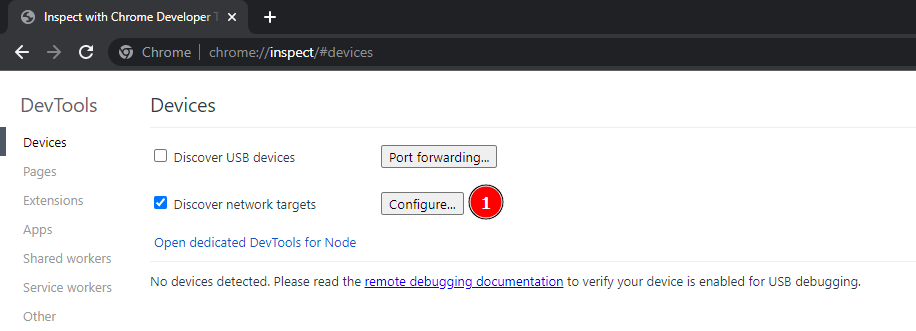
The proxy server is correctly running, you now need to open the Chrome Inspector to debug your instance. To do so, open the url chrome://inspect in the Chrome Browser. This will show you the Chrome debugger interface which will be used to debug the Kuzzle instance.
To allow the Chrome Inspector to see our proxy server exposed by the command kourou app:debug-proxy, you need to add localhost:9222 to the list of targets the Chrome Inspector can see and debug.
Here we are using the port 9222 but keep in mind that this port can be any other number. You need to change it accordingly on what port the proxy server is listening to, see end of Step 1 - Setup proxy server
The host will always be localhost since it's the IP of the proxy server that is running on your local machine.
1 - Click on the Configure button, a dialog will appear where you can enter the IP and Port of your local proxy server.
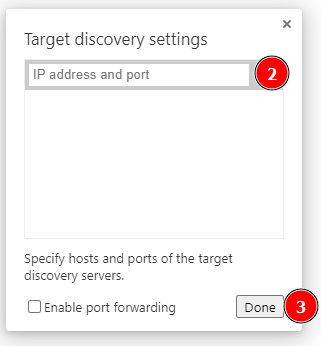
2 - Enter your local target, here localhost:9222
3 - Confirm
If everything worked so far, you should see a new Remote Target called Kuzzle Debugger - <Instance Host>:<Instance Port>.
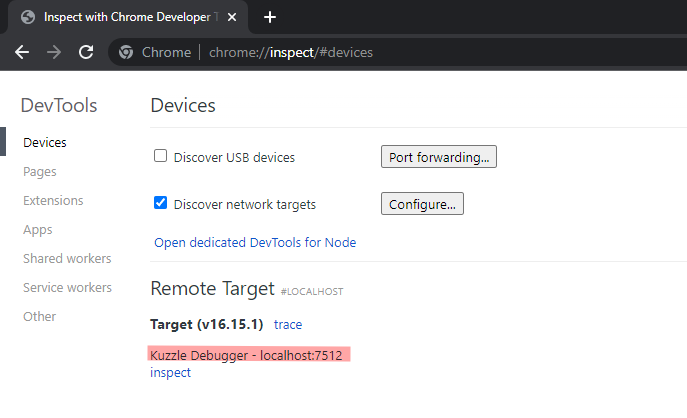
4 - You can now click on inspect and you're done.
Step 3 - Debugging #
You can now fully use the Chrome Inspector to debug you instance.
Step 4 - After Debugging #
Don't forget to set the security.debug.native_debug_protocol configuration setting back to false once you're done debugging to increase the security of your instance. Doing so, if one of your admin users with access to the Debug Controller gets compromised, it won't harm your application.