How to use Kuzzle Multi-layer Map widget #
In this guide, we will create a new Multi-layer map widget for visualizing data on an interactive map with SVG layers.
Step 1: Add a Kuzzle Multi-layer map to the report #
- Go to the Report page.
- Create a new Report or edit an existing one.
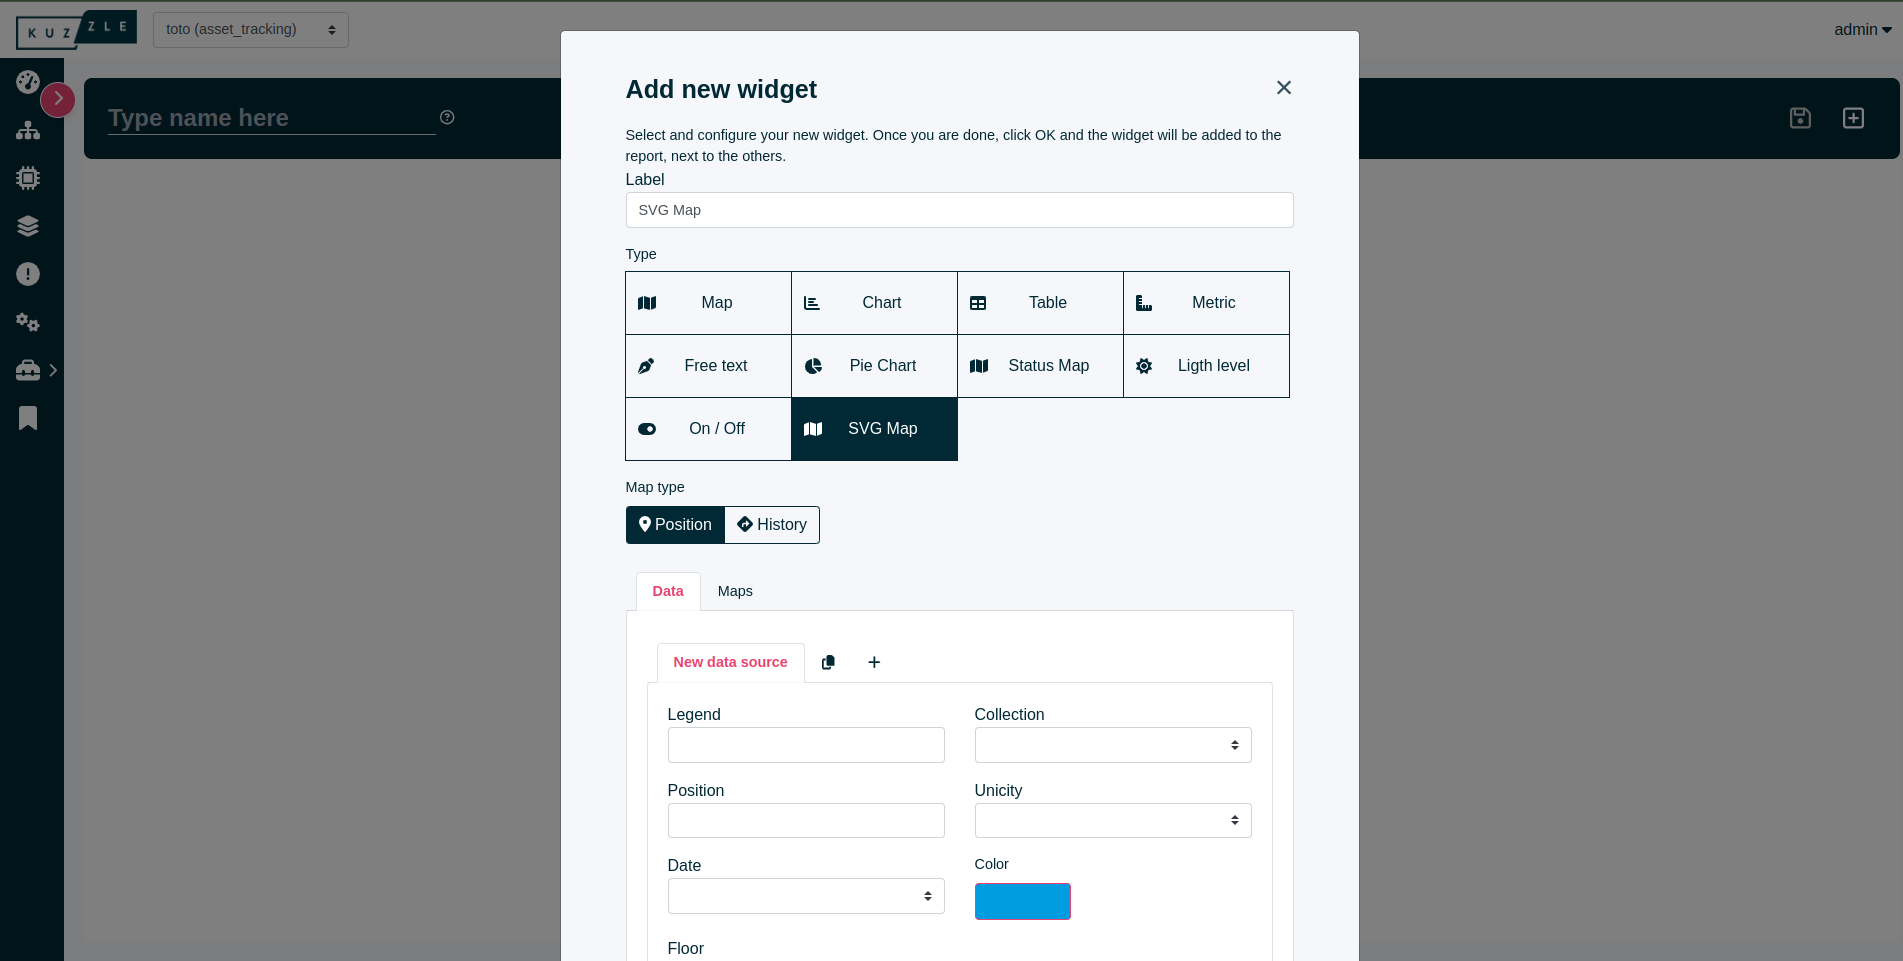
- Click "Add Widget".
- You can add a label to the widget.
- Select "Multi-layer Map" from the widget type list.
Screenshot

Step 2: Configure the data source #
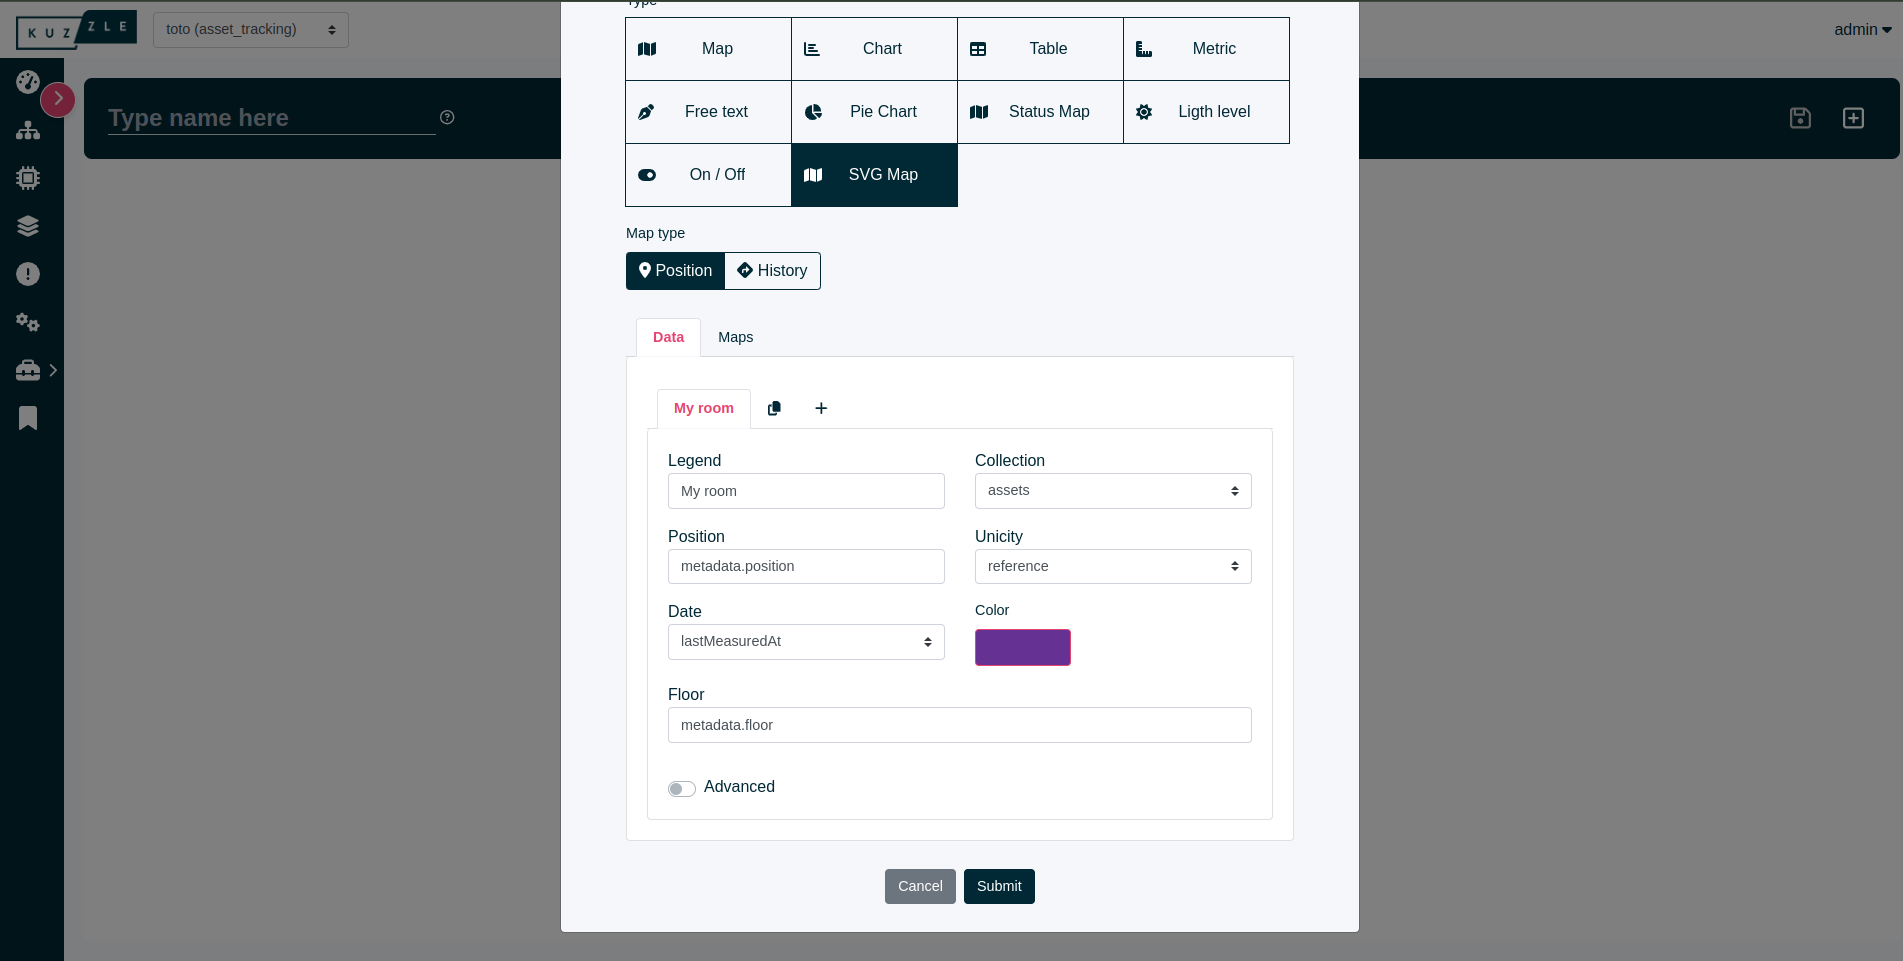
- Add a Legend to the data source. This label will be displayed in the tooltip of the marker on the map.
- Choose a Collection from which the data will be selected for the collection selected to display a marker on the map. For example, if you want to see your assets on the map, select
assetsCollection. - Select a Position field among those suggested. For a Room asset, you can choose
metadata.position. - Choose a Unicity field to ensure each marker represents a unique item.
- Select a Date field to track the time-related information.
- Choose a Color field to differentiate markers by color.
- Select a Floor field to specify where the data source marker should be displayed. If the data source doesn't have a floor field, the marker will be displayed on each floor.
Screenshot

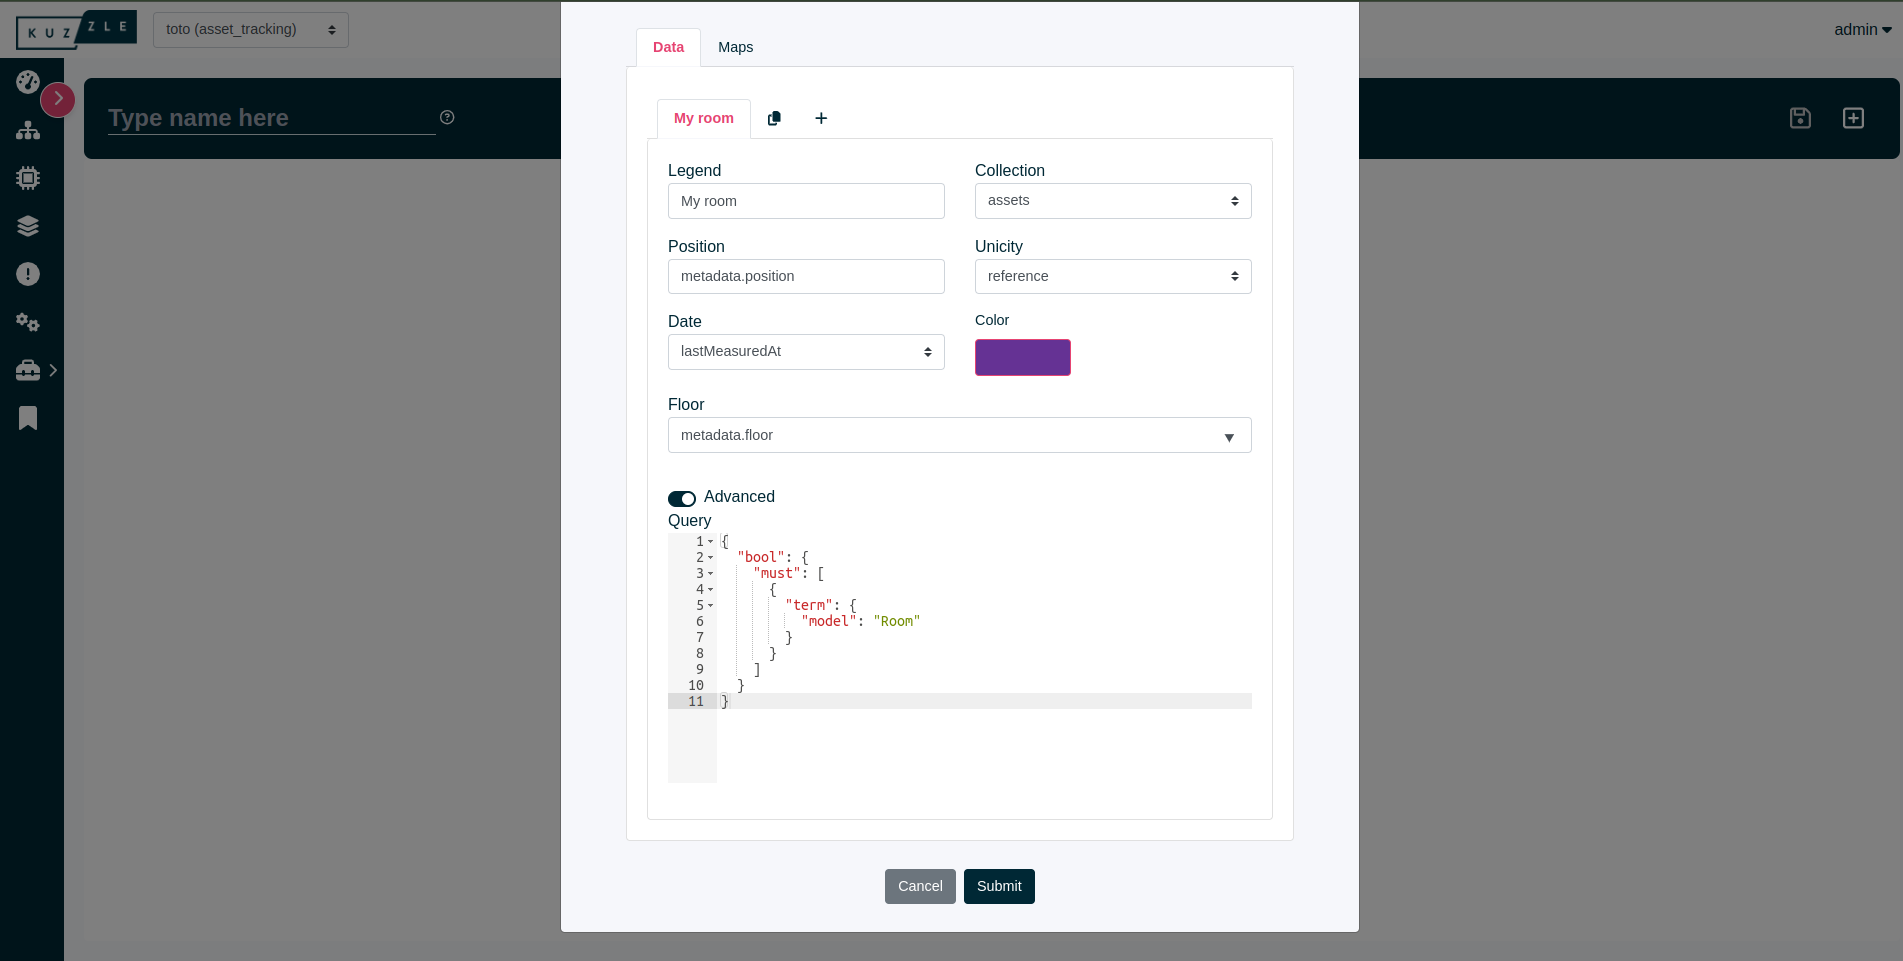
Note: You can add advanced query if you want to display only Room assets on the map, for example.
Screenshot

Step 3: Configure the SVG layers #
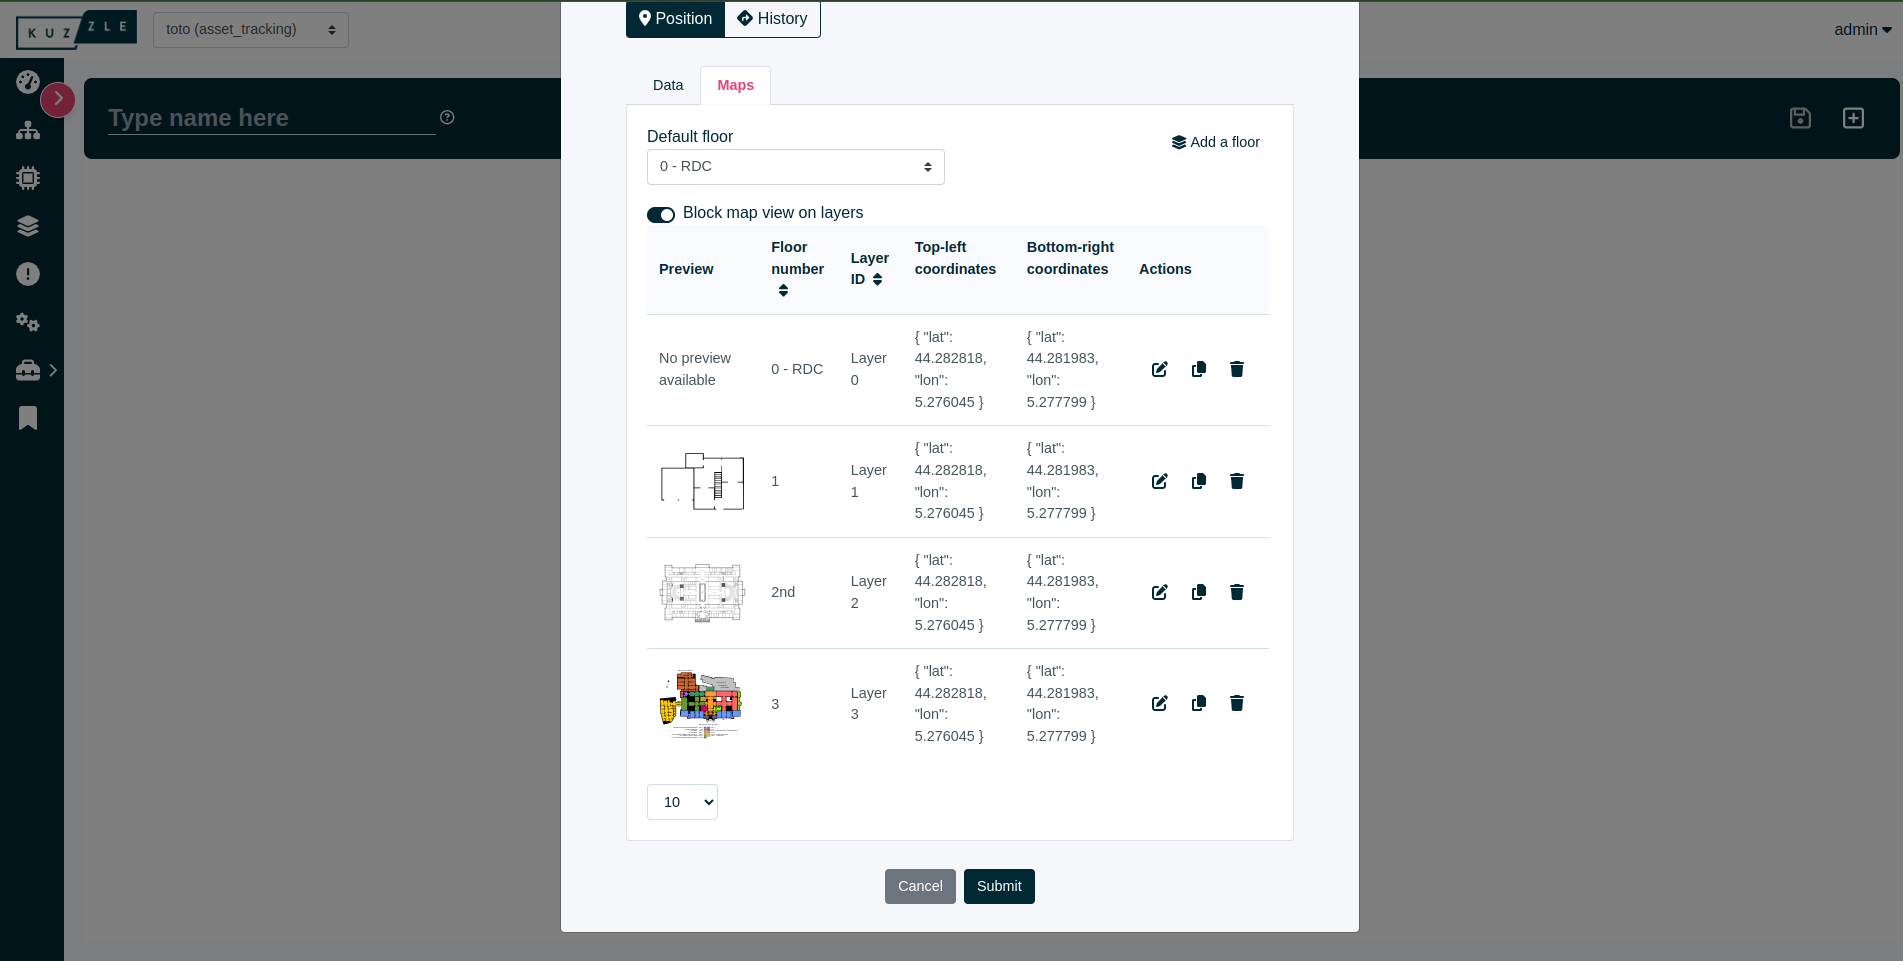
Click on the Maps tab next to the Data tab to start configuring the SVG layers for the map. First of all, decide whether you want to view the normal background map (like a standard interactive map) or block the map view to display only SVG layers. When restricted to SVG layers, the map view will be confined within the SVG layer boundaries, preventing movement beyond these bounds. Next, you can customize the SVG layers as follows:
- You'll need to edit the blank floor that is already created by clicking on the action button at the end of the line. Update the top-left and bottom-right coordinates (latitude & longitude) of the SVG layer to be displayed on the map, whether it will be displayed on the standard interactive map or if the view is blocked to the SVG layer bounds. Then, add a floor number (which can be a string) and the link (URL) to the SVG file. Confirm. The preview of your SVG file should be displayed at the beginning of the line.
- Duplicate this floor or add a new one as needed.
- Choose a default floor for the Multi-layer map widget.
- Submit your new widget.
Screenshot

Now you have successfully created an Multi-layer map widget, visualizing your data interactively on a map. You can switch between the floors and visualize the markers representing the configured data sources.